(Sample)RLC Band-pass Filter Design Tool - Result -
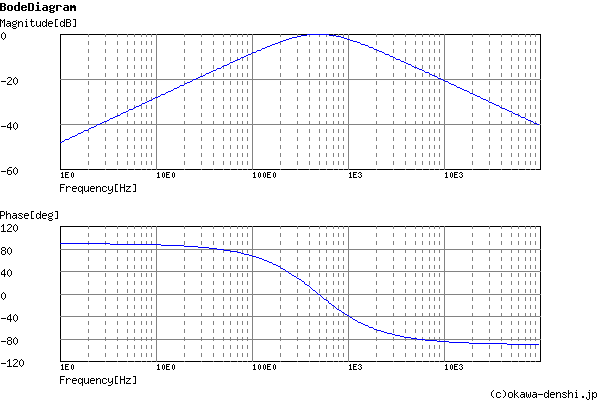
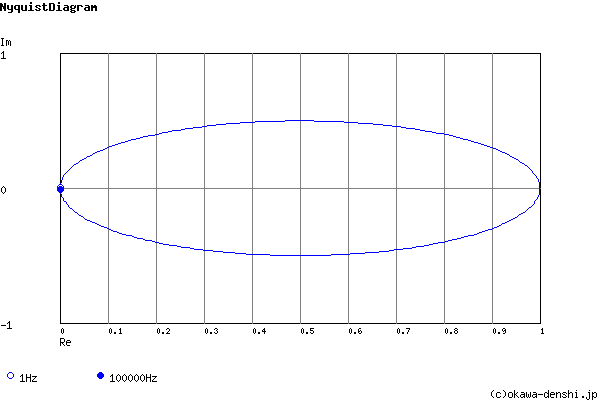
Calculated the transfer function for the RLC Band-pass filter, displayed on graphs, showing Bode diagram, Nyquist diagram, Impulse response and Step response.
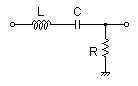
RLC Filter
| Vin(s)→ |
|
→Vout(s) |
| G(s)= |
5909.09090909s s2+5909.09090909s+9671179.88395 |
R = 13Ω
C = 47uF
L = 0.0022H
Center passes frequency
f0 = 494.948328884[Hz]
Quality factor
Q = 0.526282657637
Damping ratio
ζ = 0.95005980673
Pole(s)
p = -470.230513681 +154.457477218i[Hz]
|p|= 494.948328884[Hz]
p = -470.230513681-154.457477218i[Hz]
|p|= 494.948328884[Hz]
|p|= 494.948328884[Hz]
p = -470.230513681-154.457477218i[Hz]
|p|= 494.948328884[Hz]
Zero(s)
z = 0[Hz]
|z|= 0[Hz]
|z|= 0[Hz]
Phase margin
pm= NAN[deg] (f =0[Hz])
Oscillation frequency
f = 154.457477218[Hz]
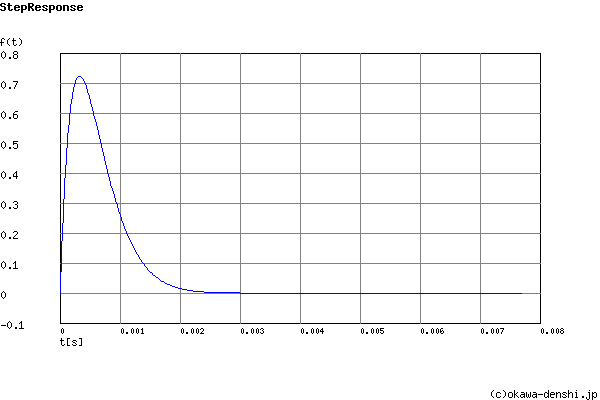
Overshoot (in absolute value)
The 1st peak gpk = 0.72 (t =0.00031[sec])
The 2nd peak gpk = -5.1E-05 (t =0.0036[sec])
The 3rd peak gpk = 3.6E-09 (t =0.0068[sec])
The 2nd peak gpk = -5.1E-05 (t =0.0036[sec])
The 3rd peak gpk = 3.6E-09 (t =0.0068[sec])
Final value of the step response (on the condition that the system converged when t goes to infinity)
g(∞) = 0
Frequency analysis
Transient analysis