(Sample) Feedback system using a Transfer Function Analysis and Design Tool - Result -
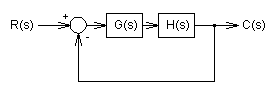
(Sample) Transfer Function from the feedback system:
|
C
R |
= |
10000s2+1000000000s+1000000000000 s3+11000s2+1100000000s+1000000000000 |
Pole(s)
p = -5041.6022387124 +32639.516083246i
|p|= 5256.3453320825[Hz]
p = -916.79552257527
|p|= 145.91253922237[Hz]
p = -5041.6022387124-32639.516083246i
|p|= 5256.3453320825[Hz]
|p|= 5256.3453320825[Hz]
p = -916.79552257527
|p|= 145.91253922237[Hz]
p = -5041.6022387124-32639.516083246i
|p|= 5256.3453320825[Hz]
Zero(s)
z = -1010.2051443364
|z|= 160.77914225801[Hz]
z = -98989.794855664
|z|= 15754.715166932[Hz]
|z|= 160.77914225801[Hz]
z = -98989.794855664
|z|= 15754.715166932[Hz]
Phase margin
pm= 49.7[deg] (f =7256.9[Hz])
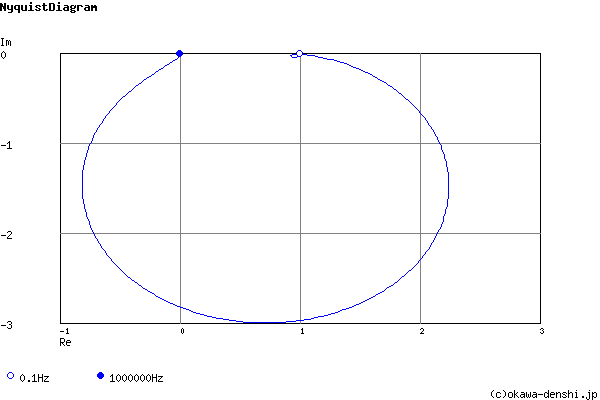
Oscillation frequency:
f = 5194.7403247761[Hz]
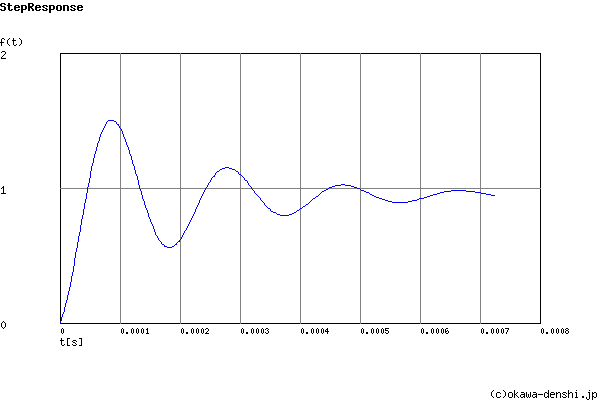
Overshoot (in absolute value)
The 1st peak gpk = 1.5 (t =8.7E-5[sec])
The 2nd peak gpk = 0.56 (t =0.00018[sec])
The 3rd peak gpk = 1.15 (t =0.00028[sec])
The 2nd peak gpk = 0.56 (t =0.00018[sec])
The 3rd peak gpk = 1.15 (t =0.00028[sec])
Final value of the step response (on the condition that the system converged when t goes to infinity)
g(∞) = 1
Frequency analysis
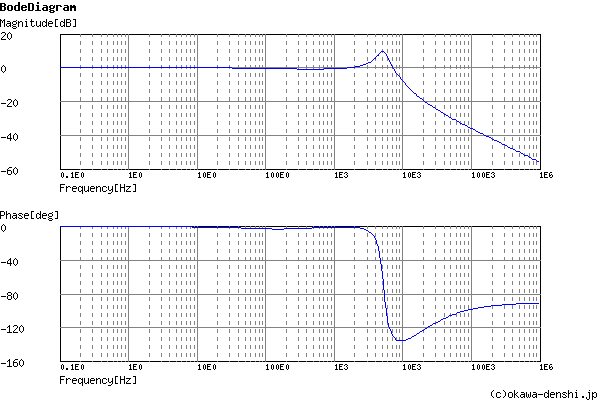
Gain characteristics at the Bode Diagram (provides up to 1 minute)
Phase characteristics at the Bode Diagram (provides up to 1 minute)
Bode Diagram text data (provides up to 1 minute)
Transient analysis