(Sample)LR High-pass Filter Design Tool - Result -
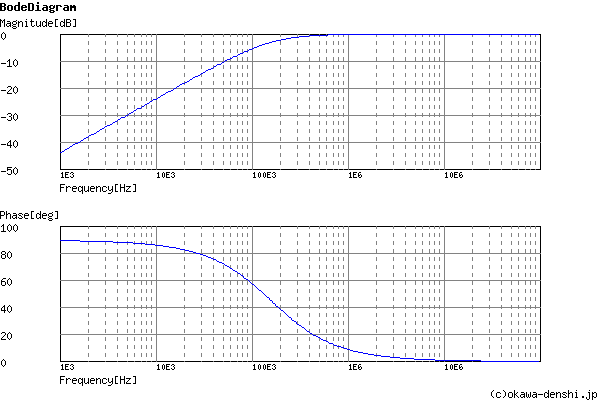
Calculated the Transfer Function for the LR High-pass filter, displayed on graphs, showing Bode diagram, Nyquist diagram, Impulse response and Step response.
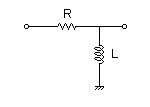
LR Filter
| Vin(s)→ |
|
→Vout(s) |
| G(s)= |
s s+1000000 |
Cut-off frequency
fc = 159154.943092[Hz]
Pole(s)
p = -159154.943092[Hz]
|p|= 159154.943092[Hz]
|p|= 159154.943092[Hz]
Zero(s)
z = 0[Hz]
|z|= 0[Hz]
|z|= 0[Hz]
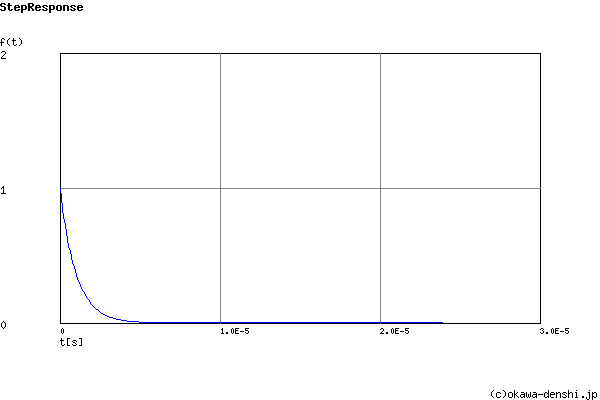
Final value of the step response (on the condition that the system converged when t goes to infinity)
g(∞) = 0
Frequency analysis
Transient analysis