(Sample) 3rd order Sallen-Key Low-pass Filter Design Tool - Result -
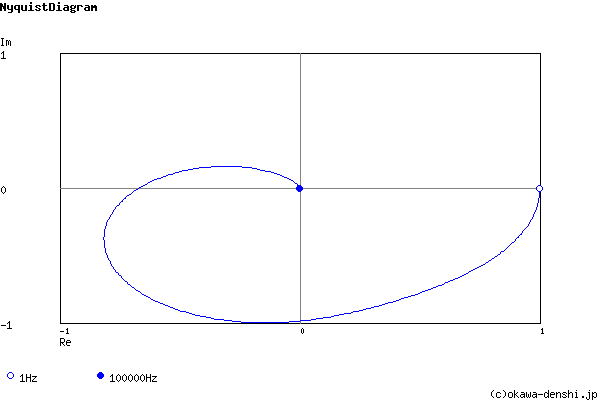
Calculated the Transfer Function for the 3rd order Sallen-Key Low-pass filter, displayed on graphs, showing Bode diagram, Nyquist diagram, Impulse response and Step response.
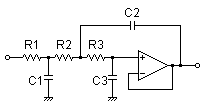
3rd order Sallen-Key filter
| Vi→ |
|
→Vo |
| G(s)= |
133362301759 s3+6607.88013729s2+50305327.1219s+133362301759 |
R1 = 9.1kΩ
R2 = 68kΩ
R3 = 36kΩ
C1 = 0.033uF
C2 = 0.015uF
C3 = 680pF
Equivalent block diagram:
| Vi(s)→ | 2πfc1 s+2πfc1 | → | (2πfc2)2 s2+2ζ(2πfc2)s+(2πfc2)2 | →Vo(s) |
Cut-off frequency fc1, fc2 of equivalent block diagram:
fc1 = 538.768389471[Hz]
fc2 = 998.954448652[Hz]
Damping ratio ζ of equivalent block diagram:fc2 = 998.954448652[Hz]
ζ = 0.256722615545
Pole(s)
p = -256.454198869 +965.474616116i[Hz]
|p|= 998.954448652[Hz]
p = -538.768389471[Hz]
|p|= 538.768389471[Hz]
p = -256.454198869-965.474616116i[Hz]
|p|= 998.954448652[Hz]
|p|= 998.954448652[Hz]
p = -538.768389471[Hz]
|p|= 538.768389471[Hz]
p = -256.454198869-965.474616116i[Hz]
|p|= 998.954448652[Hz]
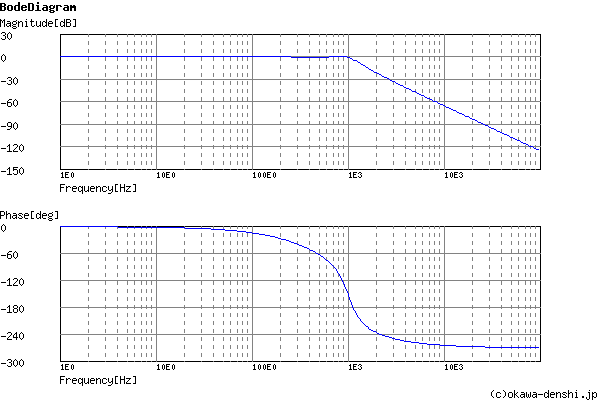
Phase margin
pm= 42.7[deg] (f =941.5[Hz])
Oscillation frequency
f = 965.474616116[Hz]
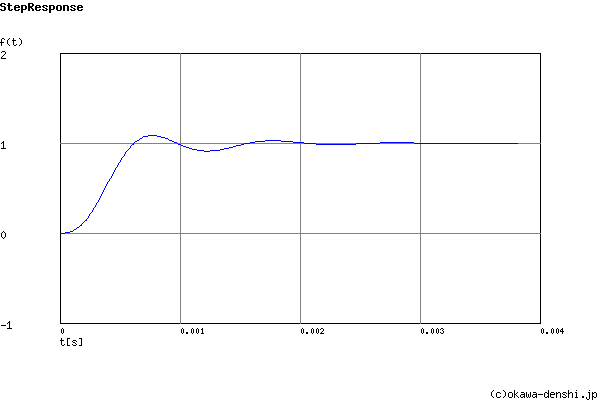
Overshoot (in absolute value)
The 1st peak gpk = 1.09 (t =0.00076[sec])
The 2nd peak gpk = 0.91 (t =0.0012[sec])
The 3rd peak gpk = 1.03 (t =0.0018[sec])
The 2nd peak gpk = 0.91 (t =0.0012[sec])
The 3rd peak gpk = 1.03 (t =0.0018[sec])
Final value of the step response (on the condition that the system converged when t goes to infinity)
g(∞) = 1
Frequency analysis
Transient analysis