(Sample)Sallen-Key High-pass Filter Design Tool - Result -
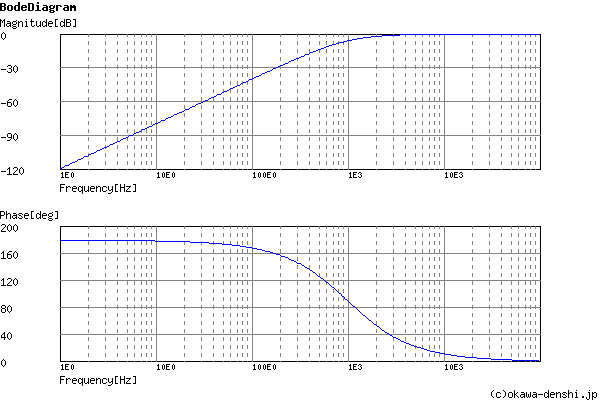
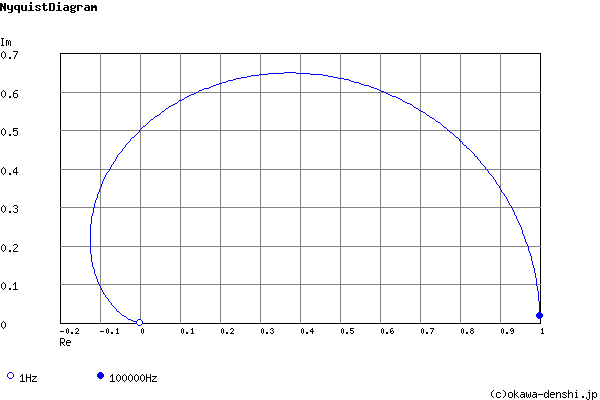
Calculated the Transfer Function for the Sallen-Key high-pass filter, displayed on graphs, showing Bode diagram, Nyquist diagram, Impulse response and Step response.
Sallen-Key High-pass Filter
| Vin(s)→ |
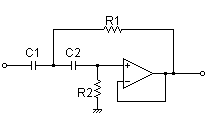
|
→Vout(s) |
| G(s)= |
s2 s2+12500s+39062500 |
R1 = 16kΩ
R2 = 16kΩ
C1 = 0.01uF
C2 = 0.01uF
Cut-off frequency
fc = 994.718394324[Hz]
Quality factor
Q = 0.5
Damping ratio
ζ = 1
Pole(s)
p = -994.718394324 +2.59971382044E-06i[Hz]
|p|= 994.718394324[Hz]
p = -994.718394324-6.59896406561E-07i[Hz]
|p|= 994.718394324[Hz]
|p|= 994.718394324[Hz]
p = -994.718394324-6.59896406561E-07i[Hz]
|p|= 994.718394324[Hz]
Zero(s)
z = 0[Hz]
|z|= 0[Hz]
z = -0[Hz]
|z|= 0[Hz]
|z|= 0[Hz]
z = -0[Hz]
|z|= 0[Hz]
Phase margin
pm= NAN[deg] (f =0[Hz])
The system does not oscillate.
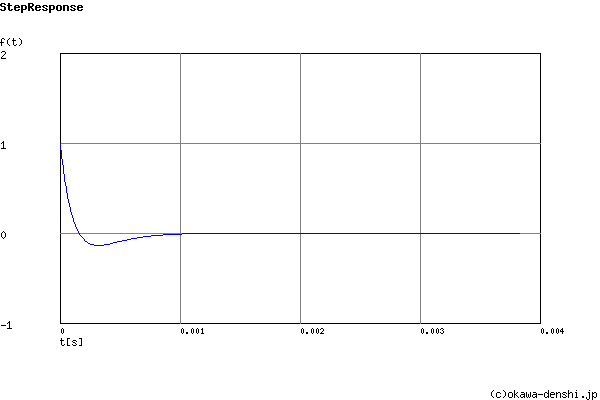
Overshoot (in absolute value)
The 1st peak gpk = -0.14 (t =0.00033[sec])
Final value of the step response (on the condition that the system converged when t goes to infinity)
g(∞) = 0
Frequency analysis
Transient analysis