(Sample)Multiple Feedback Low-pass Filter Design Tool - Result -
Calculated the Transfer Function for the multiple feedback low-pass filter, displayed on graphs, showing Bode diagram, Nyquist diagram, Impulse response and Step response.
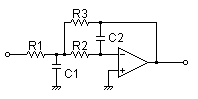
Multiple Feedback Filter
| Vin(s)→ |
|
→Vout(s) |
| G(s)= |
-39313739.3656 s2+12601.6260163s+39313739.3656 |
R1 = 8.2kΩ
R2 = 30kΩ
R3 = 8.2kΩ
C1 = 0.022uF
C2 = 0.0047uF
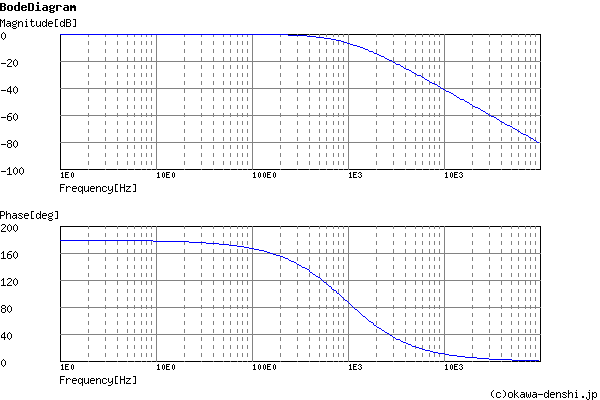
Cut-off frequency
fc = 997.912146175[Hz]
Gain at f=0Hz
Gpk = -1[times] (0)[dB]
Quality factor
Q = 0.497560150302
Damping ratio
ζ = 1.00490362762
Pole(s)
p = -903.859636226[Hz]
|p|= 903.859636226[Hz]
p = -1101.75143526[Hz]
|p|= 1101.75143526[Hz]
|p|= 903.859636226[Hz]
p = -1101.75143526[Hz]
|p|= 1101.75143526[Hz]
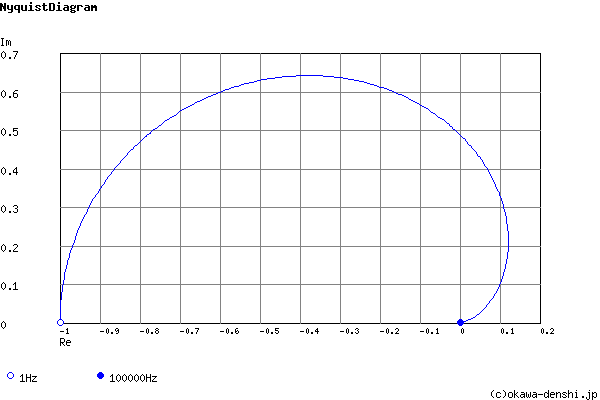
Phase margin
pm= NAN[deg] (f =0[Hz])
The system does not oscillate.
Overshoot (in absolute value)
The peak of transient waveform is not detected.
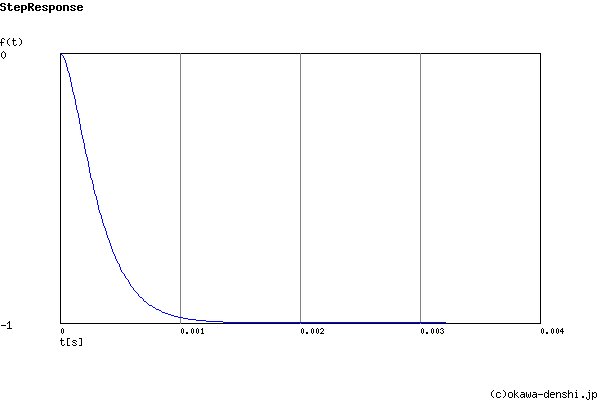
Final value of the step response (on the condition that the system converged when t goes to infinity)
g(∞) = -1
Frequency analysis
Transient analysis