(Sample)RLC Band-Stop Filter Design Tool - Result -
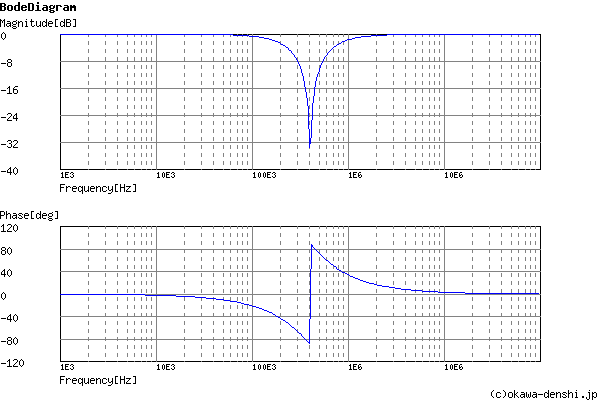
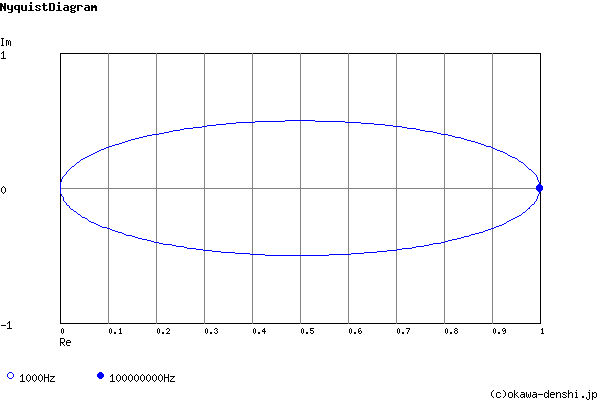
Calculated the transfer function for the RLC band-stop filter, displayed on graphs, showing Bode diagram, Nyquist diagram, Impulse response and Step response.
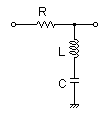
RLC Filter
| Vin(s)→ |
|
→Vout(s) |
| G(s)= |
s2+6.44745325596E+12 s2+3636363.63636s+6.44745325596E+12 |
R = 1.2Ω
C = 0.47uF
L = 0.33uH
Center rejection frequency
f0 = 404123.618269[Hz]
Quality factor
Q = 0.698275484664
Damping ratio
ζ = 0.716049769728
Pole(s)
p = -289372.623803 +282098.180491i[Hz]
|p|= 404123.618269[Hz]
p = -289372.623803-282098.180491i[Hz]
|p|= 404123.618269[Hz]
|p|= 404123.618269[Hz]
p = -289372.623803-282098.180491i[Hz]
|p|= 404123.618269[Hz]
Zero(s)
z = 0 +404123.618269i[Hz]
|z|= 404123.618269[Hz]
z = 0-404123.618269i[Hz]
|z|= 404123.618269[Hz]
|z|= 404123.618269[Hz]
z = 0-404123.618269i[Hz]
|z|= 404123.618269[Hz]
Phase margin
pm= NAN[deg] (f =0[Hz])
Oscillation frequency
f = 282098.180491[Hz]
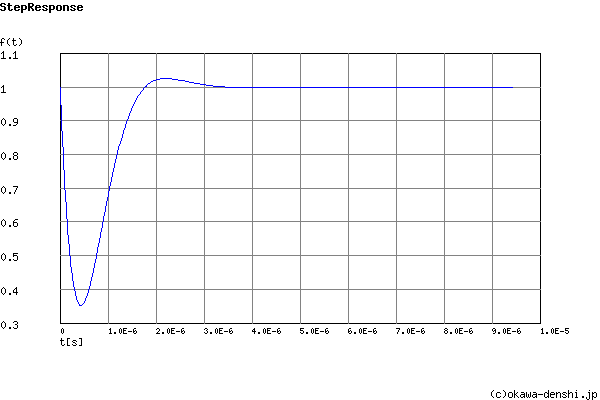
Overshoot (in absolute value)
The 1st peak gpk = 0.35 (t =4.3E-07[sec])
The 2nd peak gpk = 1.03 (t =2.2E-06[sec])
The 3rd peak gpk = 1 (t =4E-06[sec])
The 2nd peak gpk = 1.03 (t =2.2E-06[sec])
The 3rd peak gpk = 1 (t =4E-06[sec])
Final value of the step response (on the condition that the system converged when t goes to infinity)
g(∞) = 1
Frequency analysis
Transient analysis