(Sample)RLC Low-pass Filter Design Tool - Result -
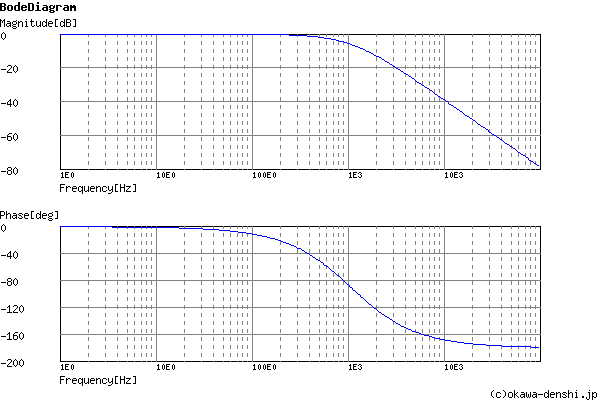
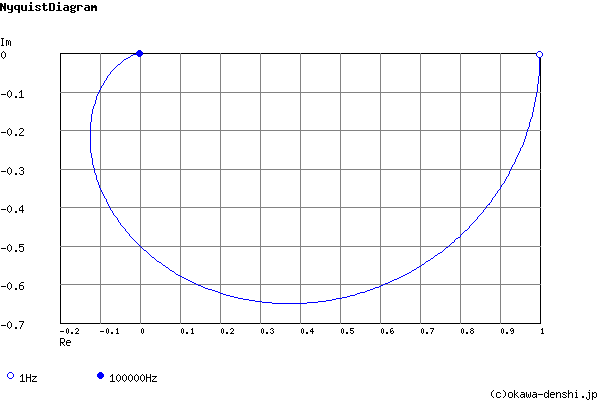
Calculated the transfer function for the RLC Low-pass filter, displayed on graphs, showing Bode diagram, Nyquist diagram, Impulse response and Step response.
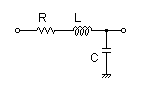
RLC Filter
| Vin(s)→ |
|
→Vout(s) |
| G(s)= |
45454545.4545 s2+13483.9972493s+45454545.4545 |
R = 1.34839972493Ω
C = 220uF
L = 100uH
Cut-off frequency
fc = 1073.02240743[Hz]
Quality factor
Q = 0.5
Damping ratio
ζ = 1
Pole(s)
p = -1073.02240194-1.24889494459E-54i[Hz]
|p|= 1073.02240194[Hz]
p = -1073.02240743-4.24913211592E-06i[Hz]
|p|= 1073.02240743[Hz]
|p|= 1073.02240194[Hz]
p = -1073.02240743-4.24913211592E-06i[Hz]
|p|= 1073.02240743[Hz]
Phase margin
pm= NAN[deg] (f =0[Hz])
The system does not oscillate.
Overshoot (in absolute value)
The peak of transient waveform is not detected.
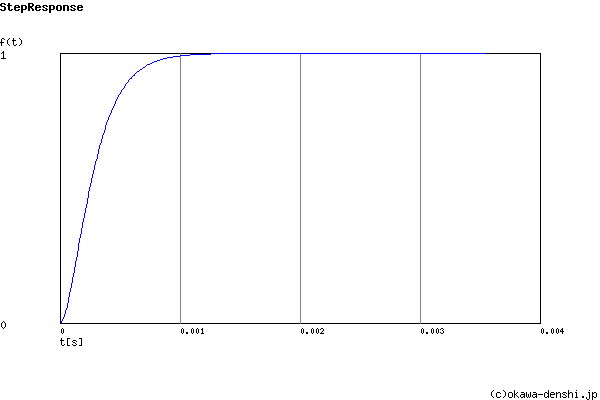
Final value of the step response (on the condition that the system converged when t goes to infinity)
g(∞) = 1
Frequency analysis
Transient analysis