(Sample) Op-amp circuit analysis using a transfer function - Result -
This tool determine the transfer function from a inverting / non-inverting amplifier circuit. The transfer function is simulated frequency analysis and transient analysis on graphs, showing Bode diagram, Nyquist diagram, Impulse response and Step response.
Op-amp circuit:
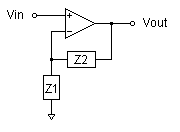
| Z1 | Z2 |

|

|
(Sample) Transfer function from the Op-amp circuit:
| G(s)= |
s2+1111000s+1010000000 s2+111000s+10000000 |
Pole(s)
p = -14.349939362259[Hz]
|p|= 14.349939362259[Hz]
p = -17651.848743838[Hz]
|p|= 17651.848743838[Hz]
|p|= 14.349939362259[Hz]
p = -17651.848743838[Hz]
|p|= 17651.848743838[Hz]
Zero(s)
z = -144.80489759888[Hz]
|z|= 144.80489759888[Hz]
z = -176676.3368775[Hz]
|z|= 176676.3368775[Hz]
|z|= 144.80489759888[Hz]
z = -176676.3368775[Hz]
|z|= 176676.3368775[Hz]
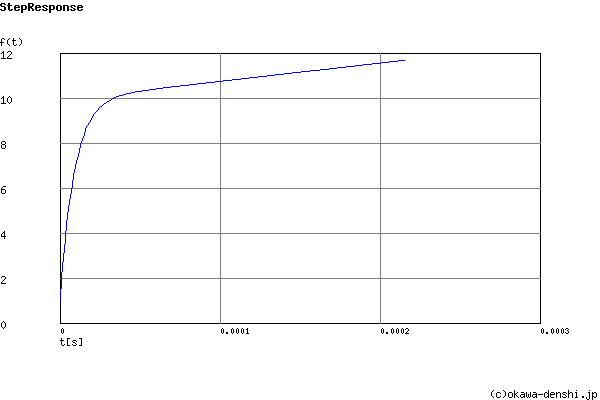
Final value of the step response (on the condition that the system converged when t goes to infinity)
g(∞) = 101
Frequency analysis
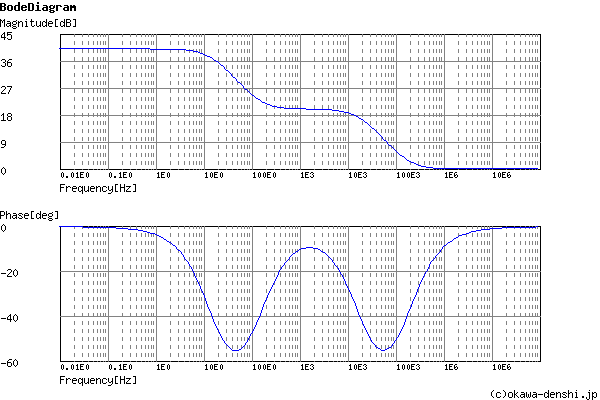
Gain characteristics at the Bode Diagram (provides up to 1 minute)
Phase characteristics at the Bode Diagram (provides up to 1 minute)
Bode Diagram text data (provides up to 1 minute)
Transient analysis