(Sample)Sallen-Key Low-pass Filter Design Tool - Result -
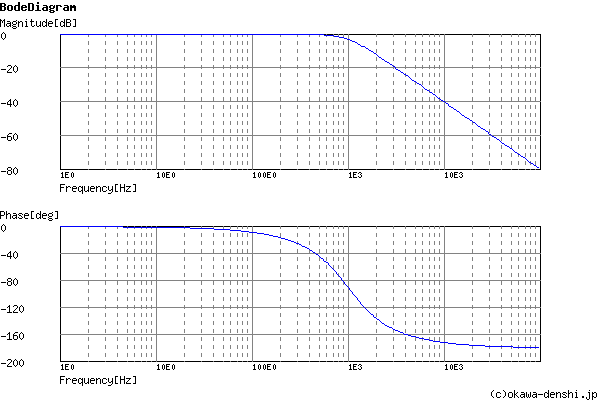
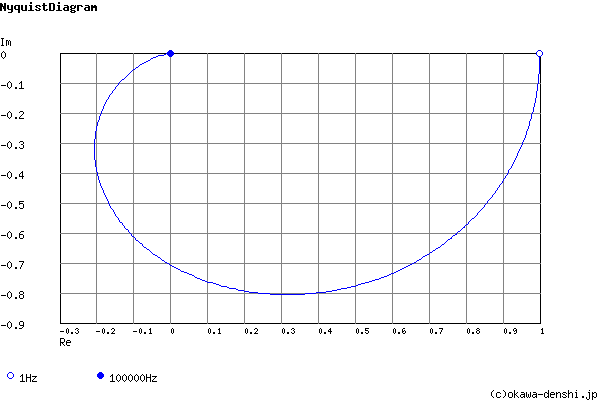
Calculated the Transfer Function for the Sallen-Key low-pass filter, displayed on graphs, showing Bode diagram, Nyquist diagram, Impulse response and Step response.
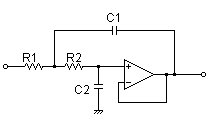
Sallen-Key Low-pass Filter
| Vin(s)→ |
|
→Vout(s) |
| G(s)= |
39401103.2309 s2+8888.88888889s+39401103.2309 |
R1 = 30kΩ
R2 = 18kΩ
C1 = 0.01uF
C2 = 0.0047uF
Cut-off frequency
fc = 999.020322137[Hz]
Quality factor
Q = 0.706165853583
Damping ratio
ζ = 0.708048962525
Pole(s)
p = -707.355302631 +705.471530171i[Hz]
|p|= 999.020322137[Hz]
p = -707.355302631-705.471530171i[Hz]
|p|= 999.020322137[Hz]
|p|= 999.020322137[Hz]
p = -707.355302631-705.471530171i[Hz]
|p|= 999.020322137[Hz]
Phase margin
pm= NAN[deg] (f =0[Hz])
Oscillation frequency
f = 705.471530171[Hz]
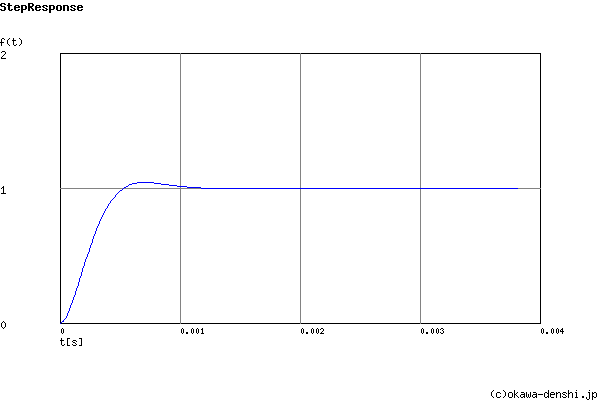
Overshoot (in absolute value)
The 1st peak gpk = 1.04 (t =0.00071[sec])
The 2nd peak gpk = 1 (t =0.0014[sec])
The 3rd peak gpk = 1 (t =0.0021[sec])
The 2nd peak gpk = 1 (t =0.0014[sec])
The 3rd peak gpk = 1 (t =0.0021[sec])
Final value of the step response (on the condition that the system converged when t goes to infinity)
g(∞) = 1
Frequency analysis
Transient analysis