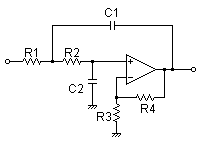
Sallen-Key Low-pass Filter Design Tool
This page is a web application that design a Sallen-Key low-pass filter. Use this utility to simulate the Transfer Function for filters at a given frequency, damping ratio ζ, Q or values of R and C. The response of the filter is displayed on graphs, showing Bode diagram, Nyquist diagram, Impulse response and Step response.
Calculate the transfer function for Sallen-Key low-pass filter with R and C values
| Vin(s)→ |
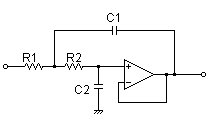
|
→Vout(s) |
Calculate the R and C values for the Sallen-Key filter at a given frequency and Q factor
| Vin(s)→ |
|
→Vout(s) |
Transfer function:
Calculate the transfer function for Sallen-Key low-pass filter with R and C values
Calculate the R and C values for the Sallen-Key filter at a given frequency and Q factor
| Vin(s)→ |
|
→Vout(s) |
Transfer function: