3rd order Multiple feedback High-pass Filter Design Tool
This page is a web calculator that design a 3rd order Multiple feedback high-pass filter.
Use this utility to simulate the Transfer Function for filters at a given frequency, damping ratio ζ or values of R and C.
The response of the filter is displayed on graphs, showing Bode diagram, Nyquist diagram, Impulse response and Step response.
Calculate the transfer function for 3rd order Multiple feedback high-pass filter with R and C values
| Vi→ |
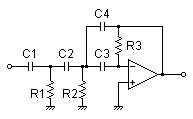
|
→Vo |
Transfer function of 3rd order Multiple feedback high-pass filter
2nd order Multiple feedback high-pass filter tool, use also.
Calculate the R and C values for the Multiple feedback filter at a given frequency and damping ratio ζ
| Vi→ |
|
→Vo |
Equivalent block diagram:
| Vi→ | s s+2πfc1 | → | Ks2 s2+2ζ(2πfc2)s+(2πfc2)2 | →Vo |
Transfer function block diagram:
Filter gain at f=∞Hz: